 Facebook
 Twitter
 Pinterest
 Copy Link
Q3 2020 Reports: Market Update


The volume of Q3 transactions made up for Q2’s fewer sales and then some. Truth be told, the market could have absorbed twice the number of transactions, if only there were more homes on the market to sell. Too few homes for sale is the defining character of the Q3 Seattle region real estate market as evidenced by multiple offer bidding wars being the norm rather than the exception. Nearly 66% of all homes sold went under contract in the first 10 days on the market at an average of 103% of their listed price in Seattle and 105% of that price on the Eastside.
As predicted by Windermere’s chief economist, Matthew Gardner, the second half of 2020 is indeed shaping up to be the brightest spot in our local economy. While consumer confidence continues to be challenged by local and national events—including COVID, unemployment, racial inequality, and uncertainty around the presidential election—the desire to secure the best home environment possible coupled with ridiculously low mortgage interest rates continue to fuel local buyer demand.
In addition to typical real estate activity, new and changing home needs (especially for those working virtually with children) have driven many to question the adequacy of their current living situation. This has added to the already significant buyer demand we are experiencing. For many, COVID has changed their perception of what is important. More buyers are reaching for their dream home or a second home in lieu of world travel and luxury goods.
As demand drives up local home prices further, affordability is quickly becoming one of the most prominent emerging concerns. Currently only a sliver of homes are considered affordable to first time buyers at their projected median income. Teachers, first responders, and critical infrastructure workers that keep our region going are finding it increasingly difficult to work in higher cost communities. Will our children be able to buy a home in the Seattle region? Not unless something changes to create lower cost housing options. One does not need a crystal ball to see that this problem will get worse when mortgage interest rates increase closer to their norms. Expect this issue to be at the center of any housing market discussion in years to come.
Click or scroll down to find your area report:
Seattle | Eastside | Mercer Island | Condos | Waterfront
SEATTLE
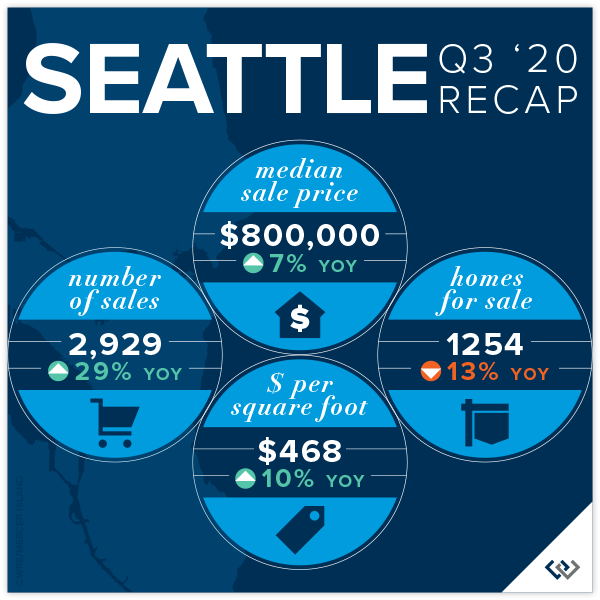
Seattle’s median sale price increased by 3% (to $800,000) over Q2 ($780,000) and by 7% over Q3 2019 ($749,000). Neighborhoods to the north experienced the largest increase in median sale price with Kenmore-Lake Forest Park (+10%) and Shoreline-Richmond Beach (+8%) over Q2. In addition, Queen Anne-Magnolia, North Seattle, Shoreline-Richmond Beach, and South Seattle all saw double-digit increases over Q3 of 2019.
71% of Seattle homes (all price points), and 18% of homes priced above $1 million, sold at or above their listed price. The most competitive Seattle markets were Kenmore-Lake Forest Park and North Seattle, with sales in the first 10 days averaging 107% and 106% of their listed price, respectively.
There were 50% more Seattle home sales in Q3 (2,929) than in Q2 (1,956) and 29% more sales than in Q3 of 2019 (2,279).
The highest Seattle home sale was a 2014-built, 6400 square foot Laurelhurst (North Seattle) waterfront home for just shy of $11.5 million and the lowest was a 1982-built, 240 square foot approved floating home in a leased slip on Lake Union (Ballard-Green Lake) for $187,500.
Click here for the full report and neighborhood-by-neighborhood statistics!

EASTSIDE
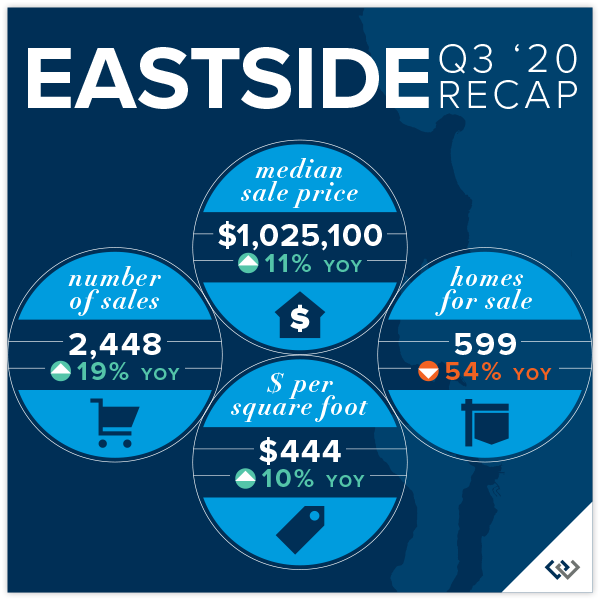
The Eastside median sale price broke the million-dollar barrier, coming in at $1,025,100 in Q3, up 7% over Q2 ($958,000) and 11% over Q3 2019 ($925,000). Kirkland-Bridle Trails (+18%) and the Eastside South of I-90 (+10%) performed best over Q2. while Eastside South, East Bellevue, West Bellevue, and East Lake Sammamish all saw double-digit increases over Q3 2019.
67% of Eastside homes, and 32% of homes priced above one million dollars, sold for at or above their listed price. The most competitive Eastside markets were East Bellevue, Mercer Island and Redmond-Carnation, with sales in the first 10 days averaging 105%, 104% and 104% of their listed price, respectively.
There were 56% more Eastside home sales in Q3 (2,448) than in Q2 (1,570) and 19% more sales than in Q3 of 2019 (2,055).
The highest sale was a $23.5 million 1908-built Hunts Point estate on 1.59 acres sold off-market and the lowest sale was a 1960-built Stossel Creek fixer without documented well or septic on 4.79 acres in Duvall for $235,000.
Click here for the full report and neighborhood-by-neighborhood statistics!
MERCER ISLAND
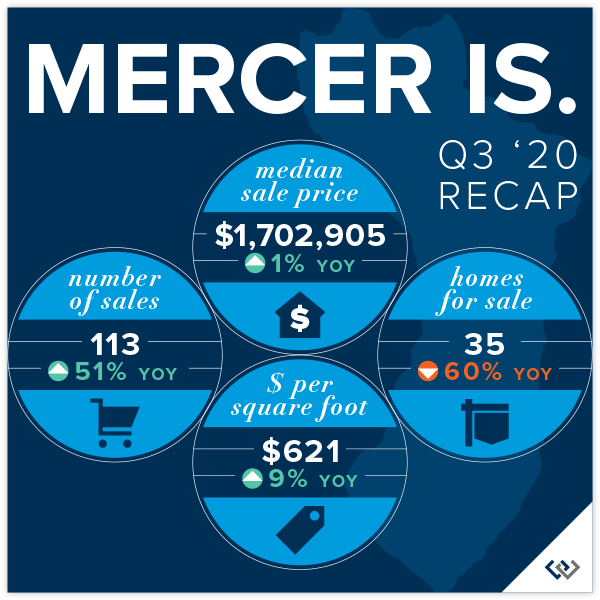
Of Mercer Island’s 113 Q3 sales, all but two were for over $1 million and 41 were above $2 million. There were 14 sales above $3 million in Q3, compared to only 4 in Q2.
As the quarter came to an end, there were only 35 homes for sale compared to 75 in Q3 2019. This shortage of available homes on the market has led to an extremely competitive market for the most desirable homes, especially those offering one-level living or a main floor owner’s suite.
58% of all homes, and 16% of homes priced above two million dollars, sold for at or above their listed price.
The highest Mercer Island sale was a $10.2 million, Faben Point waterfront home. The lowest sale was a $925,000 North End fixer sold at land value.
Click here for the full report and neighborhood-by-neighborhood statistics!
CONDOS – SEATTLE & EASTSIDE
The number of Seattle condos for sale has increased markedly, and while the pace of sales is up, it is nonetheless struggling to keep up with the volume of condos coming to market. Condos fared well overall with a median sale price up by 5% (to $479,925) over Q2 ($455,000) and by 9% over Q3 2019 ($438,500). Condos in Shoreline-Richmond Beach, Queen Anne-Magnolia, and South Seattle experienced double-digit increases in median sale price while the Downtown-Belltown median sale price was 6% lower than Q2.
54% of Seattle condos (all price points), and 4% of those priced above $1 million, sold at or above their listed price. 48% sold in the first 10 days on the market. There were 68% more Seattle condo sales in Q3 (784) than in Q2 (468) and 11% more sales than in Q3 of 2019 (706).
On the Eastside, the median sale price was down 5% to $499,950 in Q3 following a record setting Q2 ($525,000), but up 6% over Q3 2019 ($471,000). Condos in Kirkland-Bridle Trails (+13%) and West Bellevue (+11%) saw increases in median sale price while the Eastside South of I-90 (-15%) and East Bellevue (-17%) saw declines from Q2.
60% of Eastside condos (all price points), and 3% of those priced above $1 million, sold at or above their listed price. 49% sold in the first 10 days on the market. There were 72% more Eastside condo sales in Q3 (755) than in Q2 (440) and 17% more sales than in Q3 of 2019 (643).
Check out area-by-area details the full condo report.
WATERFRONT
Waterfront rebounded in a big way in Q3 with record setting sales velocity. The Eastside had more sales this quarter (18) than the last three prior quarters combined. The supply of inventory fell to 3 months (from an average of 10 months of supply) with only 16 waterfront homes for sale at quarter end. Lake Sammamish posted 14 sales after a sleepy prior four quarters with a combined total of 14 sales. For sale inventory is in step with the Eastside at 3 months of supply (from an average of 5 months of supply).
Mercer Island saw 12 waterfront sales in Q3, a sharp increase from its average of five sales per quarter. With only 8 waterfront homes on the market, Mercer Island’s available inventory fell from an average 12 months to just 2 months of supply. Seattle posted 12 sales, maintaining its typical pace of sales. There were 17 waterfront homes for sale at the end of Q3 and Seattle’s for sale inventory remained a steady 4 months of supply.
The highest sale was a $23.5 million 1908-built Hunts Point estate on 1.59 acres sold off-market with 138 feet of premium Lake Washington waterfront. The most affordable was a $1.1 million Holmes Point home built in 1928 with 36 feet of waterfront on the lake.
This top-level overview of the entire Seattle-Eastside private waterfront market, including Mercer Island and Lake Sammamish, provides a glance into the trends occurring in our region over time. Interesting, and certainly insightful, it in no way replaces an in-depth analysis on waterfront value provided by a savvy broker with years of local waterfront experience.

Find a Home | Sell Your Home | Property Research
Neighborhoods | Market Reports | Our Team
We earn the trust and loyalty of our brokers and clients by doing real estate exceptionally well. The leader in our market, we deliver client-focused service in an authentic, collaborative and transparent manner and with the unmatched knowledge and expertise that comes from decades of experience.
2737 77th Ave SE, Mercer Island, WA 98040 | (206) 232-0446 mercerisland@windermere.com
© Copyright 2020, Windermere Real Estate/Mercer Island. Information and statistics derived from Northwest Multiple Listing Service and deemed accurate but not guaranteed.
Q2 2020 Reports: Market Update


Q2 was a story of resilience for the Seattle market. It began with our region fully entrenched in a new normal amidst the COVID-19 pandemic, but ended with a strong seller’s market and historic low interest rates. Buyers have returned in droves to battle for the limited supply of homes for sale. With a shortage of listings due both to economic/health concerns and sellers who can’t find anywhere to go, we could double our current supply of homes for sale and still fall short of demand.
Our region’s typical peak season was delayed with April feeling more like February and picking up momentum through the end of June. Possibly motivated as much by the changing home requirements of our newly revised lifestyles as it is by the opportunity to snag a coveted mortgage interest rate (a 1% change in interest rate equates to a 10% change in buying power), buyers are eager to find a place to call home.
Residential home prices are generally up throughout the region in Q2 while condominium prices are mixed depending on the building amenities and how well they have addressed COVID-19 concerns.
Click or scroll down to find your area report:
Seattle | Eastside | Mercer Island | Condos | Waterfront
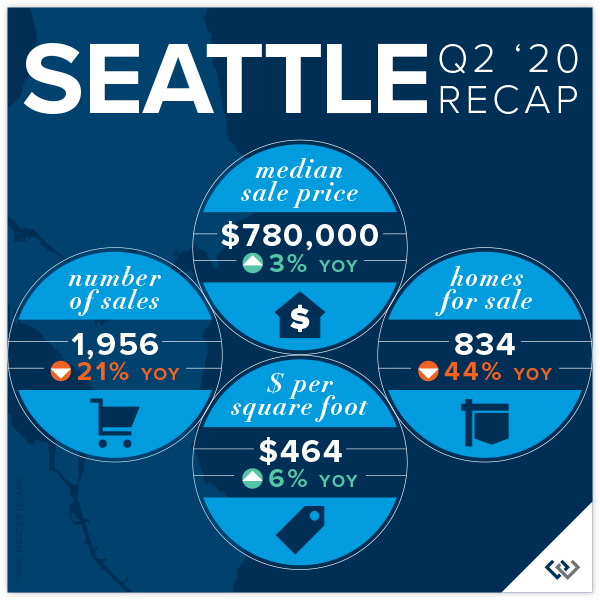
SEATTLE
Seattle’s median sale price increased by 3% in Q2 to $780,000. Queen Anne-Magnolia (+8%) and South Seattle (+7%) were top performers in the Seattle region while the Richmond Beach-Shoreline area was down 1% compared to Q2 2019.
68% of Seattle homes (all price points) sold at or above their listed price, while only 15% of homes priced above $1 million did so. The average number of days to sell decreased to 20 from 27 in Q2 of the year prior. There were 21% fewer Seattle home sales in Q2 2020 (1,956) compared to Q2 2019 (2,479) due to a shortage of homes for sale.
The highest Seattle home sale was a 2008-built Laurelhurst (North Seattle) waterfront home for $10,500,000 and the lowest was a 1979-built 1-bedroom approved floating home in a leased slip on Lake Union for $134,000..
Click here for the full report and neighborhood-by-neighborhood statistics!

EASTSIDE
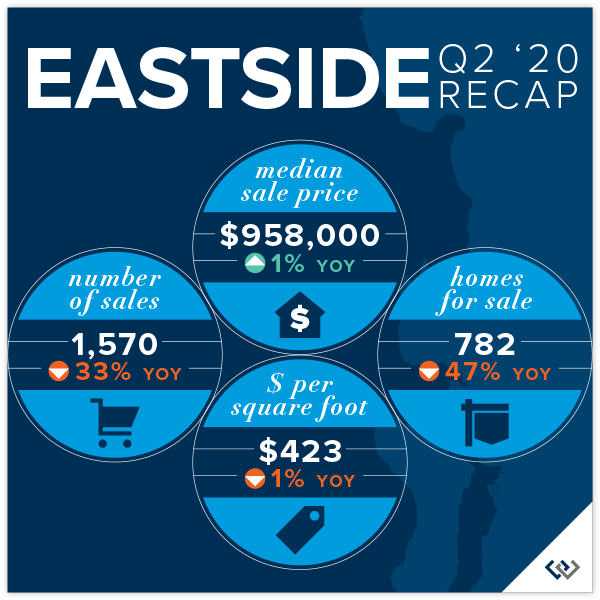
The Eastside median sale price was $958,000 in Q2, up 1% over Q2 2019. West Bellevue (+10%) and East Bellevue (+8%) performed best, while Mercer Island saw an 11% decrease in its median sale price with fewer luxury sales.
65% of Eastside homes, and 26% of homes priced above one million dollars, sold for at or above their listed price. The average number of days to sell decreased to 24 from 36 in Q2 of the year prior. There were 33% fewer Eastside home sales in Q2 2020 (1,570) compared to Q2 2019 (2,334) due to fewer homes available for sale.
The highest sale was a $11.75 million 2004-built Evergreen Point shared waterfront home on just over an acre and the lowest sale was a 1924 Skykomish cabin on Old Cascade Hwy.
Click here for the full report and neighborhood-by-neighborhood statistics!

MERCER ISLAND
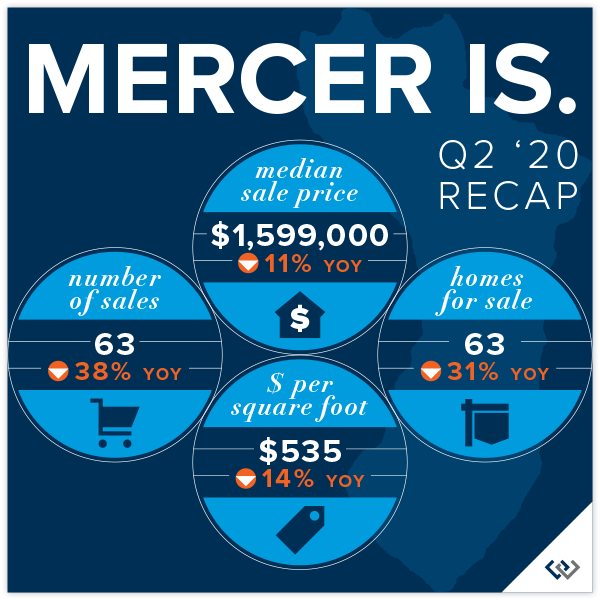
There was not a single Mercer Island home sale below $1 M in Q2. The bulk of Island sales were in the $1.2 M to $2 M price point (40 of 63 sales) and there were only four sales above $3 M.
The Island’s record shortage of homes for sale in Q2 continues to create a bottleneck of buyer activity with multiple offers common in the $1.2 M to $2 M segment of the market. Buyers are winning the competition by pre-inspecting and waiving typical contingencies more so that drastically escalating offer prices.
52% of all homes, and 8% of homes priced above two million dollars, sold for at or above their listed price. The highest Mercer Island sale was a $4.185 million, 2002-built Eastside waterfront home. Two “as-is” mid-island homes tied for the lowest sale of at $1,000,000.
Click here for the full report and neighborhood-by-neighborhood statistics!
CONDOS – SEATTLE & EASTSIDE
Condo sales have been more impacted by COVID-19 concerns than most residential homes. Condo buildings with individual outside access and those with stellar cleanliness policies tended to be more desirable than buildings that did not clearly address exposure concerns.
The Seattle median condo sale price was down 6% to $455,000 in Q2 as compared to Q2 2019 ($483,500). There were only 468 sales for the quarter vs. 764 sales in the same quarter last year. Downtown-Belltown condos (+6%) outperformed the region while Richmond Beach & Shoreline condos were down 20% over Q2 of the prior year (fewer higher end sales). 55% of Seattle condos (all prices), and 4% of condos priced above one million dollars, sold for at or above their listed price.
On the Eastside, the median sale price was up 9% to $525,000 (from $460,000 in Q2 2019). East Bellevue (+21%) and Redmond (+19%) condos far outpaced gains seen in surrounding cities. A total of 440 units sold on the Eastside this quarter. 65% of all Eastside condos, and 6% of those priced above one million dollars, sold for at or above their listed price.
Check out all of these factoids and more in the full condo report.
WATERFRONT
Sales of waterfront homes in Q2 with exclusive (not shared) access to the water picked up some momentum after a sleepy Q1 but remain far below typical norms. Seattle had 12 private waterfront home sales while Mercer Island and Lake Sammamish each had 5 sales and the Eastside had 4 sales.
Six (23%) of the 26 total sales closed at higher than their listing price, including one West of Market sale that went for $2 M above its listed price. Three sales (12%) closed right at their listed price and 17 (65%) closed below their listed price. Homes sold above their listed price sold in an average of 27 days for 11% higher than list. Homes sold below their listed price sold in an average of 125 days for 6% less than their listed price.
The highest Q2 private waterfront sale was in Laurelhurst at $10.5 million with 145 feet of Lake Washington waterfront. The most affordable was a $1.6 million West Lake Sammamish home with 50 feet of waterfront on the lake.
This top-level overview of the entire Seattle-Eastside private waterfront market, including Mercer Island and Lake Sammamish, provides a glance into the trends occurring in our region over time. Interesting, and certainly insightful, it in no way replaces an in-depth analysis on waterfront value provided by a savvy broker with years of local waterfront experience.
Find a Home | Sell Your Home | Property Research
Neighborhoods | Market Reports | Our Team
We earn the trust and loyalty of our brokers and clients by doing real estate exceptionally well. The leader in our market, we deliver client-focused service in an authentic, collaborative and transparent manner and with the unmatched knowledge and expertise that comes from decades of experience.
2737 77th Ave SE, Mercer Island, WA 98040 | (206) 232-0446 mercerisland@windermere.com
© Copyright 2020, Windermere Real Estate/Mercer Island. Information and statistics derived from Northwest Multiple Listing Service and deemed accurate but not guaranteed.
Q1 2020 Reports: Market Update


As we are fully entrenched in a new normal amidst the COVID-19 pandemic, it is important to note that the Q1 stats you see are based on pre-coronavirus closed sales activity and therefore largely untouched by our current market reality.
While Q1 serves as a pre-coronavirus benchmark, Q2 and Q3 will more accurately show the impacts of the (necessary) stay home order and resulting economic fallout. Our region stands to rebound more quickly than many US markets due to its pre-coronavirus strength.
Q1 saw a continued inventory shortage, although many homes were just queuing up to come on the market prior to the outbreak. Mortgage interest rates hit new lows in March (down about 1% from a year ago) bringing the typical monthly payment down significantly. For reference, a 1% change in interest rate equates to about a 10% change in buying power (i.e. an $800,000 home at 3.4% costs about the same per month as a $720,000 home at 4.4% interest).
Click or scroll down to find your area report:
Seattle | Eastside | Mercer Island | Condos | Waterfront
SEATTLE
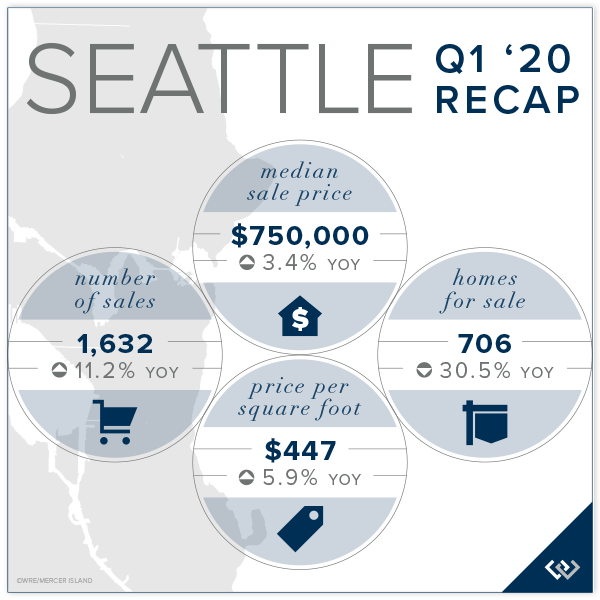
There were 11.2% more Seattle home sales in Q1 2020 (1,632) compared to Q1 2019 (1,468). Seattle’s median sale price increased by an average of 3.4% in 2019 to $750,000. Lake Forest Park (+8.0%) and Queen Anne-Magnolia (+7.0%) were the area’s top performers. The Central Seattle was down 6.9% over Q1 2019, much of which can be attributed to fewer luxury market sales and a higher percentage of smaller homes transacting during that period.
In Q1, 68.0% of Seattle homes (all price points) sold at or above their listed price, while only 13.7% of homes priced above $1 million did so. The average number of days to sell decreased to 41 from 50 in Q1 of the year prior.
The highest Seattle home sale was a 1930-built Lake Forest Park waterfront home for $5,000,000 and the lowest was a 1955-built 2-bedroom Skyway home for $215,000.
Click here to view the complete report for a neighborhood by neighborhood breakdown of Average Sale Price, size, and number of homes sold.

EASTSIDE
In Q1, 64.6% of Eastside homes, and 28.6% of homes priced above one million dollars, sold for at or above their listed price.
The Eastside median sale price was $989,500 in Q1, up 6.8% over Q1 2019. South Eastside (+18.1%) and Kirkland (+14.1%) performed best, while Woodinville saw a 2.5% decrease in its median sale price. The highest sale was an $11.5 million Medina waterfront home and the lowest sale was a 1960’s Lake Margaret area cottage.

Click here for the full report and neighborhood-by-neighborhood statistics!
MERCER ISLAND
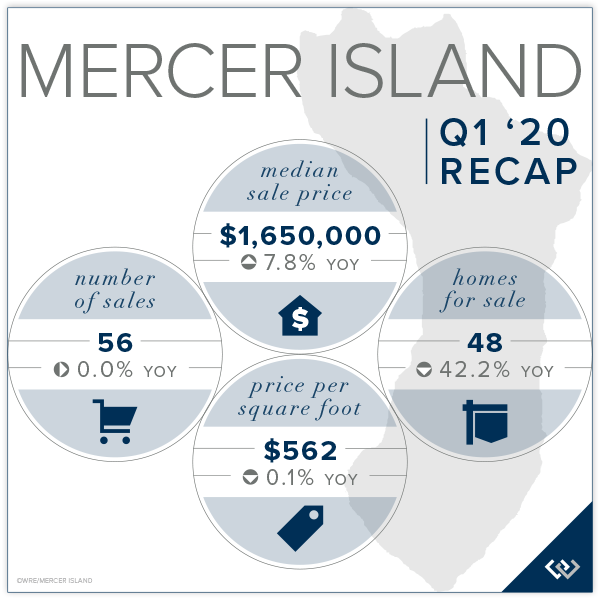
Mercer Island has seen a record shortage of homes on the market in Q1 with the lack of homes for sale dominating conversations between buyers and their brokers. There were 56 home sales in the first quarter, with only 6 homes sold below $1 million and 19 with sale prices above $2 million.
In Q1, 48.2% of all homes, and 12.5% of homes priced above two million dollars, sold for at or above their listed price. The highest Mercer Island sale was a $4.8 million waterfront home on the north-eastern tip of the Island. The lowest was a $815,000 renovation/rebuild ready rambler on West Mercer Way.
Click here to view the complete report for a neighborhood by neighborhood breakdown of Average Sale Price, size, and number of homes sold.
CONDOS – SEATTLE & EASTSIDE
Seattle’s condo median sale price was the same in Q1 2020 as in Q 1 2019 ($460,000) with 605 units transacting. The North Seattle (+28.3%) and Richmond Beach-Shoreline (+18.4%) outperformed the region while West Seattle condos were down 5.0% over Q1 of the prior year. In Q1, 53.7% of Seattle condos (all prices), and 3.1% of condos priced above one million dollars, sold for at or above their listed price.
On the Eastside, the median sale price was up 6.5% to $490,000. Woodinville (+21.4%) and Redmond (+17.2%) condos outpaced those in surrounding cities while East Bellevue condos sold for 23.2% less than in Q1 2019. There were 528 units sold on the Eastside this quarter.
In Q1, 67.4% of all Eastside condos, and 4.2% of those priced above one million dollars, sold for at or above their listed price.
Check out all of these factoids and more in the full condo report.
WATERFRONT
The pace of waterfront transactions has been slowing over the past few quarters, driven in large part by fewer international buyers in the market. Even so, Q1 was markedly off for waterfront sales. The Eastside had 3 private waterfront home sales. Seattle had 8, Mercer Island had 2, and Lake Sammamish had no sales in the first three months on 2020.
The highest private waterfront sale in Q1 was on Lake Washington in Medina at $11.5 million. The most affordable waterfront sale was a $1.5 million Beach Drive West Seattle home with 22 feet of waterfront on Puget Sound. Note this report includes privately-owned, rather than shared, waterfront transactions only.
This top-level overview of the entire Seattle-Eastside private waterfront market, including Mercer Island and Lake Sammamish, provides a glance into the trends occurring in our region over time. Interesting, and certainly insightful, it in no way replaces an in-depth analysis on waterfront value provided by a savvy broker with years of local waterfront experience.
Find a Home | Sell Your Home | Property Research
Neighborhoods | Market Reports | Our Team
We earn the trust and loyalty of our brokers and clients by doing real estate exceptionally well. The leader in our market, we deliver client-focused service in an authentic, collaborative and transparent manner and with the unmatched knowledge and expertise that comes from decades of experience.
2737 77th Ave SE, Mercer Island, WA 98040 | (206) 232-0446 mercerisland@windermere.com
© Copyright 2020, Windermere Real Estate/Mercer Island. Information and statistics derived from Northwest Multiple Listing Service and deemed accurate but not guaranteed.
Q1 2019 Reports: How’s the Market?


Be forewarned, this quarter’s report looks somewhat dismal. There are two very relevant facts that should be taken into consideration when reviewing it. The first is that Q1 is nearly always the worst performing quarter of any year because the sales completed in Q1 typically went under contract between late November and the end of February—a notably quieter time of year in our seasonal Seattle market.
The second aspect to consider is that Q1 of 2018 was an atypically strong quarter and likely marked the peak of the current real estate cycle as buyers approach this year’s spring market with cautious optimism rather than the reckless abandon that we witnessed in the first four months of last year.
Since then, mortgage interest rates rose in November to a seven-year high of 4.87% and then subsequently came down to 4.27% in March—creating enough of a stir to get buyers attention. Each 1% increase in mortgage interest rate is equivalent to a 10% increase in home price. Conversely, a half point drop in the rate is comparable to a 5% price reduction.
Sellers and buyers are beginning the second quarter on more equal footing than they’ve had since the late 1990’s as we’ve rapidly oscillated between a seller’s market, a buyer’s market, and then a seller’s market again with little breathing room in between. Sellers have enjoyed a seven-year run with double digit annual appreciation most of those years. Buyers have enjoyed record setting low interest rates and can purchase today at what amounts to roughly 60% of the monthly expense of the forty-seven-year average 8.09% mortgage interest rate.
The market has much to offer buyers and sellers this year. We believe those looking to make a move in the next few years should do so this year when they can still secure incredibly affordable mortgage financing. Today’s buyers should be prepared to stay in their home at least five years. Home sellers moving to lower cost regions may also benefit from selling now. We know that every situation is unique, and we are here to help you evaluate your personal real estate holdings and purchase strategy.
Click or scroll down to find your area report:
Seattle | Eastside | Mercer Island | Condos | Waterfront
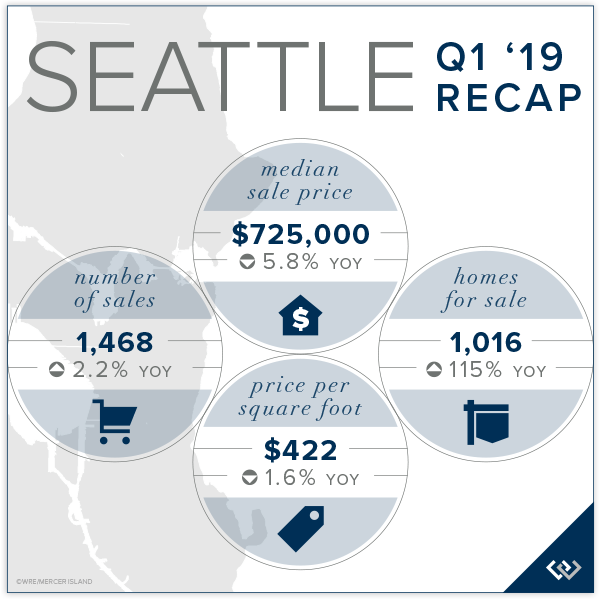
SEATTLE
The number of homes for sale more than doubled in Q1 compared to one year ago giving buyers options and compelling sellers to put their best foot forward. Seattle’s overall Median Sale Price was down 5.8% from Q1 2018 to $725,000 and down 1.4% from Q4. The Average $ Per Square Foot was down 1.6% from Q1 last year to $422. Queen Anne-Magnolia and North Seattle were the most impacted markets with the largest decrease in median price. As disappointing as the numbers are, Seattle homeowners have seen a 60% increase in the Median Sale Price over the past five years.
Click here to view the complete report for a neighborhood by neighborhood breakdown of Average Sale Price, size, and number of homes sold.

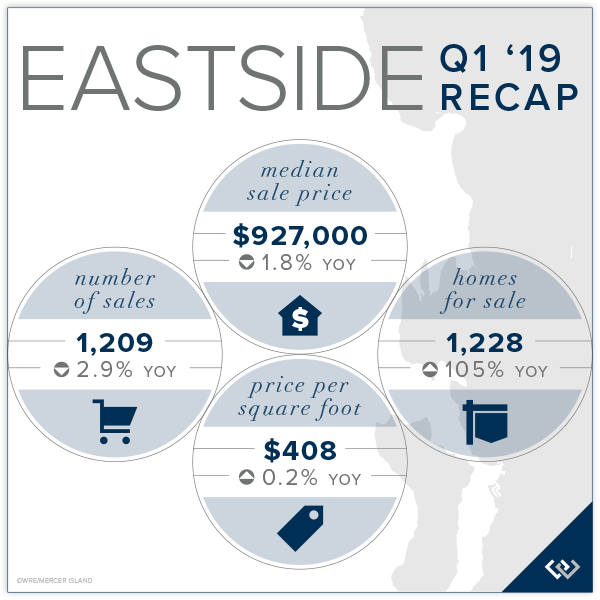
EASTSIDE
Continued employment growth and planned expansion on the Eastside have benefitted homeowners as compared to Seattle as Bellevue, Redmond and Kirkland prepare for unprecedented development in the next decade. The Eastside’s Median Sale Price was down 1.8% from Q1 2018 to $927,000, but up 3.9% from Q4. The five-year Eastside median price trend is up 53% over 2014.
East Bellevue, East of Lake Sammamish, and Woodinville performed best in Q1—all with median price increases rather than reductions. A total of 1,209 home sales closed in Q1, which was down significantly from Q4, but down only slightly from the robust Q1 2018.
Click here for the full report and neighborhood-by-neighborhood statistics!

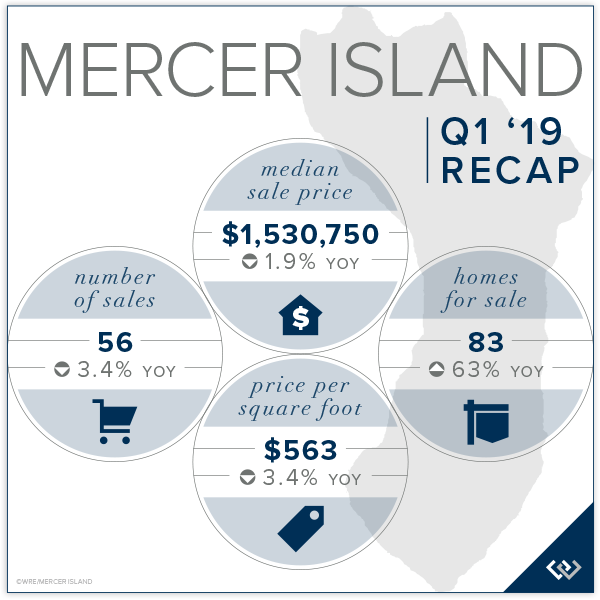
MERCER ISLAND
Following a 10% Median Sale Price increase in 2018, the Mercer Island median fell 1.9% in Q1 2019 from Q1 2018 and 10.9% from Q4. Fewer luxury sales—only one waterfront sold in Q1—and lower demand contributed to the off quarter. The lower velocity of luxury sales impacted the Average Sale Price even more so than Realistically priced homes in solid condition and with desirable lot amenities and settings will do well in Q2 as they are met with demand from the greatest segment of buyers.
Click here to view the complete report for a neighborhood by neighborhood breakdown of Average Sale Price, size, and number of homes sold.

CONDOS – SEATTLE & EASTSIDE
Affordability and access to transportation and amenities continues to drive condo desirability, but a nearly three-fold increase in the number of units for sale and softening apartment rents have tempered demand in some areas.
Seattle’s Condo Median Sale Price was down 4% from Q4 and 10.7% from Q1 2018 to $460,000 following a 12.8% median price increase in 2018. The Average $ Per Square Foot was $577. West Seattle and Queen Anne condos fared better than average while condos prices to the north softened a bit more.
The Eastside’s Condo Median Sale Price was down 5.5% from Q4 and 4.2% from Q1 2018 to $460,000—the same as Seattle—following a 17.2% median price increase in 2018 and a 20.6% increase in 2017. The Average $ Per Square Foot was $431. South Eastside and Mercer Island condos performed better than average while Kirkland condos struggled in Q1.
Check out all of these factoids and more in the full condo report.

WATERFRONT
The Eastside had more private waterfront activity than Seattle, Mercer Island & Lake Sammamish combined. Seattle and Mercer Island sales were far slower than typical in Q1 with only two sales in Seattle and one sale on Mercer Island reported to NWMLS. Mercer Island had eight Q1 sales in 2017 and five in 2018. Seattle had six Q1 sales in 2017 and 3 in 2018.
The highest Q1 sale was a 1963 Yarrow Point home on 80 feet of waterfront sold at $8,650,000 after only 5 days on the market. The lowest sale was a 1940 Pleasure Point bungalow in South Bellevue with 45 feet of waterfront for $1,560,000 on the market for 7 days. Waterfront homes sold in Q1 tended to either sell immediately or languish on the market for months with very few finding middle ground.
This top-level overview of the entire Seattle-Eastside private waterfront market, including Mercer Island and Lake Sammamish, provides a glance into the trends occurring in our region over time. Interesting, and certainly insightful, it in no way replaces an in-depth analysis on waterfront value provided by a savvy broker with years of local waterfront experience.
Check out the full Waterfront Report for a complete list of waterfront home sales by address and community.

ABOUT WINDERMERE MERCER ISLAND
We earn the trust and loyalty of our brokers and clients by doing real estate exceptionally well. The leader in our market, we deliver client-focused service in an authentic, collaborative and transparent manner and with the unmatched knowledge and expertise that comes from decades of experience.

© Copyright 2019, Windermere Real Estate/Mercer Island. Information and statistics derived from Northwest Multiple Listing Service and deemed accurate but not guaranteed.
