 Facebook
 Twitter
 Pinterest
 Copy Link


Be forewarned, this quarter’s report looks somewhat dismal. There are two very relevant facts that should be taken into consideration when reviewing it. The first is that Q1 is nearly always the worst performing quarter of any year because the sales completed in Q1 typically went under contract between late November and the end of February—a notably quieter time of year in our seasonal Seattle market.
The second aspect to consider is that Q1 of 2018 was an atypically strong quarter and likely marked the peak of the current real estate cycle as buyers approach this year’s spring market with cautious optimism rather than the reckless abandon that we witnessed in the first four months of last year.
Since then, mortgage interest rates rose in November to a seven-year high of 4.87% and then subsequently came down to 4.27% in March—creating enough of a stir to get buyers attention. Each 1% increase in mortgage interest rate is equivalent to a 10% increase in home price. Conversely, a half point drop in the rate is comparable to a 5% price reduction.
Sellers and buyers are beginning the second quarter on more equal footing than they’ve had since the late 1990’s as we’ve rapidly oscillated between a seller’s market, a buyer’s market, and then a seller’s market again with little breathing room in between. Sellers have enjoyed a seven-year run with double digit annual appreciation most of those years. Buyers have enjoyed record setting low interest rates and can purchase today at what amounts to roughly 60% of the monthly expense of the forty-seven-year average 8.09% mortgage interest rate.
The market has much to offer buyers and sellers this year. We believe those looking to make a move in the next few years should do so this year when they can still secure incredibly affordable mortgage financing. Today’s buyers should be prepared to stay in their home at least five years. Home sellers moving to lower cost regions may also benefit from selling now. We know that every situation is unique, and we are here to help you evaluate your personal real estate holdings and purchase strategy.
Click or scroll down to find your area report:
Seattle | Eastside | Mercer Island | Condos | Waterfront
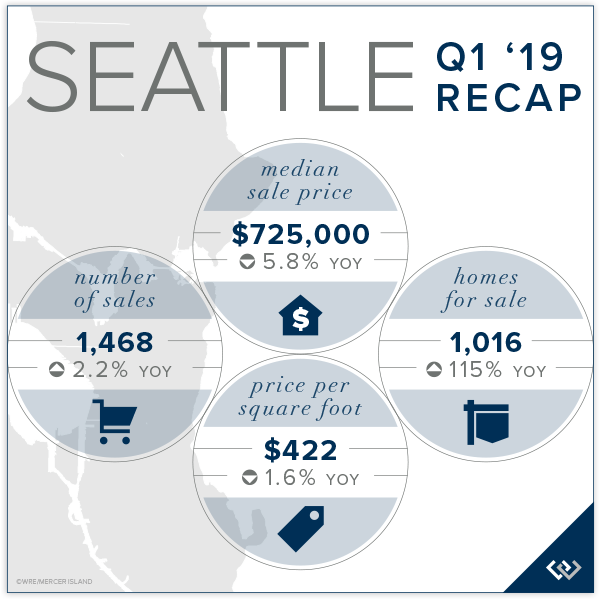
SEATTLE
The number of homes for sale more than doubled in Q1 compared to one year ago giving buyers options and compelling sellers to put their best foot forward. Seattle’s overall Median Sale Price was down 5.8% from Q1 2018 to $725,000 and down 1.4% from Q4. The Average $ Per Square Foot was down 1.6% from Q1 last year to $422. Queen Anne-Magnolia and North Seattle were the most impacted markets with the largest decrease in median price. As disappointing as the numbers are, Seattle homeowners have seen a 60% increase in the Median Sale Price over the past five years.
Click here to view the complete report for a neighborhood by neighborhood breakdown of Average Sale Price, size, and number of homes sold.

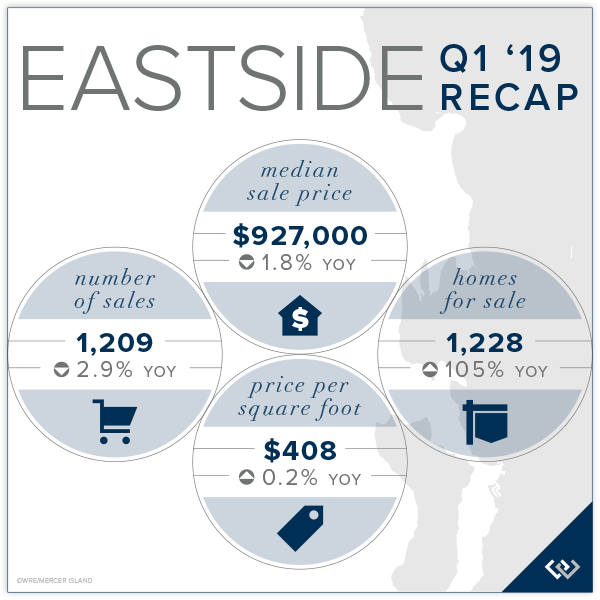
EASTSIDE
Continued employment growth and planned expansion on the Eastside have benefitted homeowners as compared to Seattle as Bellevue, Redmond and Kirkland prepare for unprecedented development in the next decade. The Eastside’s Median Sale Price was down 1.8% from Q1 2018 to $927,000, but up 3.9% from Q4. The five-year Eastside median price trend is up 53% over 2014.
East Bellevue, East of Lake Sammamish, and Woodinville performed best in Q1—all with median price increases rather than reductions. A total of 1,209 home sales closed in Q1, which was down significantly from Q4, but down only slightly from the robust Q1 2018.
Click here for the full report and neighborhood-by-neighborhood statistics!

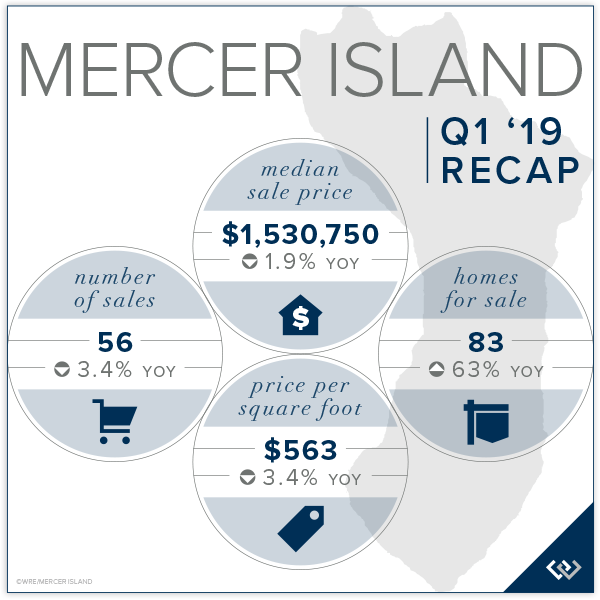
MERCER ISLAND
Following a 10% Median Sale Price increase in 2018, the Mercer Island median fell 1.9% in Q1 2019 from Q1 2018 and 10.9% from Q4. Fewer luxury sales—only one waterfront sold in Q1—and lower demand contributed to the off quarter. The lower velocity of luxury sales impacted the Average Sale Price even more so than Realistically priced homes in solid condition and with desirable lot amenities and settings will do well in Q2 as they are met with demand from the greatest segment of buyers.
Click here to view the complete report for a neighborhood by neighborhood breakdown of Average Sale Price, size, and number of homes sold.

CONDOS – SEATTLE & EASTSIDE
Affordability and access to transportation and amenities continues to drive condo desirability, but a nearly three-fold increase in the number of units for sale and softening apartment rents have tempered demand in some areas.
Seattle’s Condo Median Sale Price was down 4% from Q4 and 10.7% from Q1 2018 to $460,000 following a 12.8% median price increase in 2018. The Average $ Per Square Foot was $577. West Seattle and Queen Anne condos fared better than average while condos prices to the north softened a bit more.
The Eastside’s Condo Median Sale Price was down 5.5% from Q4 and 4.2% from Q1 2018 to $460,000—the same as Seattle—following a 17.2% median price increase in 2018 and a 20.6% increase in 2017. The Average $ Per Square Foot was $431. South Eastside and Mercer Island condos performed better than average while Kirkland condos struggled in Q1.
Check out all of these factoids and more in the full condo report.

WATERFRONT
The Eastside had more private waterfront activity than Seattle, Mercer Island & Lake Sammamish combined. Seattle and Mercer Island sales were far slower than typical in Q1 with only two sales in Seattle and one sale on Mercer Island reported to NWMLS. Mercer Island had eight Q1 sales in 2017 and five in 2018. Seattle had six Q1 sales in 2017 and 3 in 2018.
The highest Q1 sale was a 1963 Yarrow Point home on 80 feet of waterfront sold at $8,650,000 after only 5 days on the market. The lowest sale was a 1940 Pleasure Point bungalow in South Bellevue with 45 feet of waterfront for $1,560,000 on the market for 7 days. Waterfront homes sold in Q1 tended to either sell immediately or languish on the market for months with very few finding middle ground.
This top-level overview of the entire Seattle-Eastside private waterfront market, including Mercer Island and Lake Sammamish, provides a glance into the trends occurring in our region over time. Interesting, and certainly insightful, it in no way replaces an in-depth analysis on waterfront value provided by a savvy broker with years of local waterfront experience.
Check out the full Waterfront Report for a complete list of waterfront home sales by address and community.

ABOUT WINDERMERE MERCER ISLAND
We earn the trust and loyalty of our brokers and clients by doing real estate exceptionally well. The leader in our market, we deliver client-focused service in an authentic, collaborative and transparent manner and with the unmatched knowledge and expertise that comes from decades of experience.

© Copyright 2019, Windermere Real Estate/Mercer Island. Information and statistics derived from Northwest Multiple Listing Service and deemed accurate but not guaranteed.
